 NexScrm官方博客
To track the click-through rate of a LINE rich menu (called "Rich menus" in the backend), follow these steps: Log in to the LINE Official Account Manager web backend, go to "Analytics → Rich menus", select a time period, retrieve the impression count and click count, and calculate the total click-through rate using "clicks ÷ impressions × 100%". Then look at the click distribution of each button block to determine which entry points are actually being used.
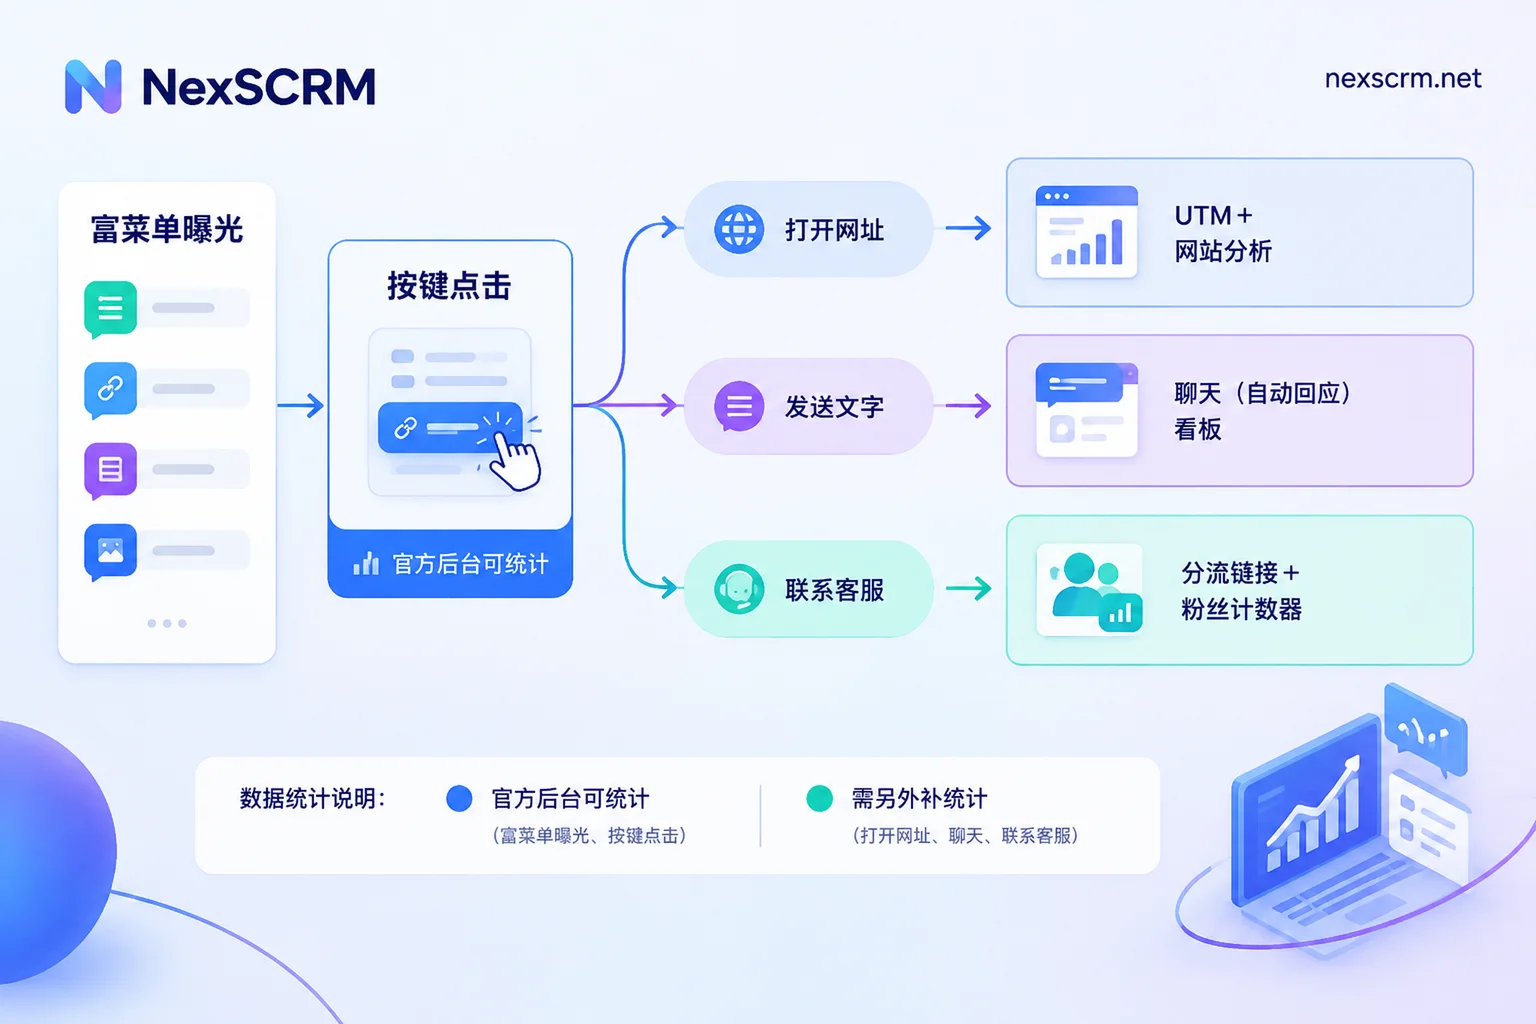
The official backend data only goes as far as "which part of the menu the user clicked". What webpage the user opened after clicking, whether they contacted customer service, or whether they sent an inquiry — the backend cannot see any of that. You need to supplement tracking separately based on the type of action each button performs. Below, we explain in order: data extraction, calculation, closing the loop, and building a weekly table.
First, confirm that this menu has data in the backend
Before starting, rule out two common situations so you don't mistake normal behavior for a data error:
- How the menu was created. Rich menus created in the LINE Official Account Manager web backend can be viewed directly in "Analytics". Rich menus created via the Messaging API generally cannot be viewed directly in backend analytics; you need to call the API's statistics endpoints or check in the connected third-party system. If the menu was published by a developer colleague or an external system, first clarify which method was used.
- Data comes only from mobile. LINE's Windows and macOS desktop clients do not display rich menus by default, so backend impressions and clicks essentially all come from mobile users. If your customers often use the desktop version of LINE, the menu data will underestimate their needs; these users are more likely to type their questions directly in the chat.
Step 1: Export raw data from the backend
- Log in to the LINE Official Account Manager web version and select the official account you want to analyze.
- Click "Analytics" in the top navigation bar.
- Select "Rich menus" from the left menu.
- Choose the time period and view impressions, clicks, unique clicking users, and the click distribution of each button block.
- Export the CSV or Excel report and save it to your team's tracking sheet.
The backend provides raw summary numbers and charts; you need to calculate the click-through rate yourself. The official documentation does not specify exactly what time the data updates, so for weekly reports it's best to only include data up to the previous day or earlier, and treat the current day's numbers as reference only. For the location and meaning of each metric in the interface, see Where to find and how to calculate LINE rich menu click-through rate.
Step 2: Calculate click-through rates using three different methods
There are three commonly used ratios, each answering a different question:
| Metric | Formula | Answers |
|---|---|---|
| Total click-through rate | Total clicks ÷ impressions × 100% | Is anyone clicking the menu overall? |
| Unique click-through rate | Unique clicking users ÷ unique users who saw the menu × 100% | What proportion of people who saw the menu used it? |
| Per-button contribution rate | Clicks on that block ÷ total menu clicks × 100% | Which entry point are clicks concentrated on? |
Here's a simple example: In a given week, the menu had 20,000 impressions and 1,600 clicks, so the total click-through rate is 8%. Of those, the "Contact support" block received 640 clicks, so its per-button contribution rate is 40%.
Note three things when calculating:
- Don't mix counts and users in division. Total clicks should be divided by impressions, and unique clicking users should be divided by unique users who saw the menu. If you can't get the number of unique users who saw the menu, only report the total click-through rate and the number of unique clicking users. Don't divide unique clicking users by impressions — that will give a rate that's too low and doesn't mean anything useful.
- Segment calculations after changing the menu. After changing the layout, button text, or button actions, calculate data before and after the change separately. Otherwise, mixing old and new versions will make the contribution rate meaningless.
- When clicks far exceed unique clicking users, look at the landing content. The same group of people repeatedly clicking the same entry point may indicate they didn't find what they wanted after clicking, such as repeatedly clicking "Check order" without getting results. It's worth checking the content behind that button.
Step 3: Supplement post-click data based on button actions
The click-through rate only tells you whether an entry point is being used. To judge whether a button is fulfilling its purpose, first look at what action it's set to perform.
Action is "Open URL". Once users leave LINE, their browsing, lead generation, and purchases can't be tracked by the official backend. You can add UTM parameters to each button's link, then check in website analytics tools like Google Analytics. For example:
https://example.com/catalog?utm_source=line&utm_medium=richmenu&utm_content=button_a
Use a different utm_content value for each button. When the menu version changes, add utm_campaign to distinguish versions, so every visit on the website can be traced back to the specific button and menu version.
Action is "Send text" (triggers keyword auto-reply). In the backend "Analytics" → "Chat (auto-reply)" dashboard, you can see the trigger count and trend for this keyword, which can indirectly verify the usage of this button. If users also manually type the same keyword, those triggers will be included, so it won't exactly match the button clicks.
Action is "Contact support" or "Add sales". The official backend only knows that someone clicked this button, not whether they actually started a conversation with support or which agent handled it. If your team uses multiple LINE accounts to share support duties, you can generate split links in NexSCRM and replace this button's original link with it. Clicking users will be automatically assigned to different support accounts, and the follower counter will track the actual number of new followers and new conversations each account handles. Comparing these numbers with the button's clicks in the backend reveals how much is lost between "click → conversation started". For setup instructions, see Follower counter and split link tracking. The software is priced per port; you can apply for a free trial on the Pricing and trial page to run a week of comparison data with your own account first.
Step 4: Organize into a fixed weekly table
It's recommended to update at the same time each week. The table can include these columns:
- Reporting period, menu version
- Impressions, clicks, total click-through rate
- Unique clicking users (if unique users who saw the menu are available, add a column for unique click-through rate)
- Clicks and contribution rate for each button
- Post-click data for each button: for URL type, fill in website visits or leads (from UTM); for text type, fill in keyword trigger count; for support type, fill in new conversation count and new follower count.
When reviewing the table, comparing the same button across different weeks and menu versions is more informative than just looking at absolute numbers for a single week. Click volume is also affected by the number of friends and broadcast activities — for example, after a broadcast, more people open the chat, so impressions and clicks typically rise together. When interpreting changes, record the timing of such activities in the table as well.
What to check first when data looks abnormal
- No data in the backend at all: First confirm whether the menu was created via the Messaging API, then confirm whether the menu was displayed and active during the reporting period.
- Click-through rate suddenly drops: First check whether the menu was changed during this period, or whether there was a sudden large increase in new friends. New friends' usage habits may differ from existing friends, which can lower the overall rate.
- A button gets many clicks but little follow-up data: For URL type, first check whether the link and landing page open properly; for support type, first check whether responses are timely. If users added you as a friend but never reply, see What to do when LINE friends don't interact.


Comments(0)