 NexScrm官方博客
To check the click-through rate of a LINE Rich Menu, log in to the LINE Official Account Manager web backend using a computer browser, click "Analysis" at the top, then select "Rich menus" from the left sidebar. Here you can see overall impressions and clicks for the menu, as well as click data for each button area. You can also customize the date range and export CSV.
The backend only provides raw numbers, so you need to calculate the click-through rate yourself. Below, we first explain how to find and calculate the data, then cover several situations where data is missing or inconsistent.
Steps to View
- Using an account with admin permissions, log in to LINE Official Account Manager in a computer browser.
- Click "Analysis" in the top navigation (labeled "分析" in Traditional Chinese, "Insight" in English).
- Select "Rich menus" from the left menu (labeled "圖文選單" in Traditional Chinese).
- Choose the date range and view the report. Export CSV if you need to combine it with other data for analysis.
The interface text may vary slightly by language and region, but the layout is essentially the same. Whether the mobile LINE Official Account App shows the same detailed per-area data is not specified in official documentation. For the complete report, we recommend using the computer web backend.
What Metrics Are in the Report and How to Calculate CTR
The backend provides Rich Menu metrics in three groups:
- Overall impressions: impression count (exposures) and unique impression users
- Overall clicks: click count and unique click users
- Per-area clicks: click count and unique click users for each button area (Action Area) in the menu
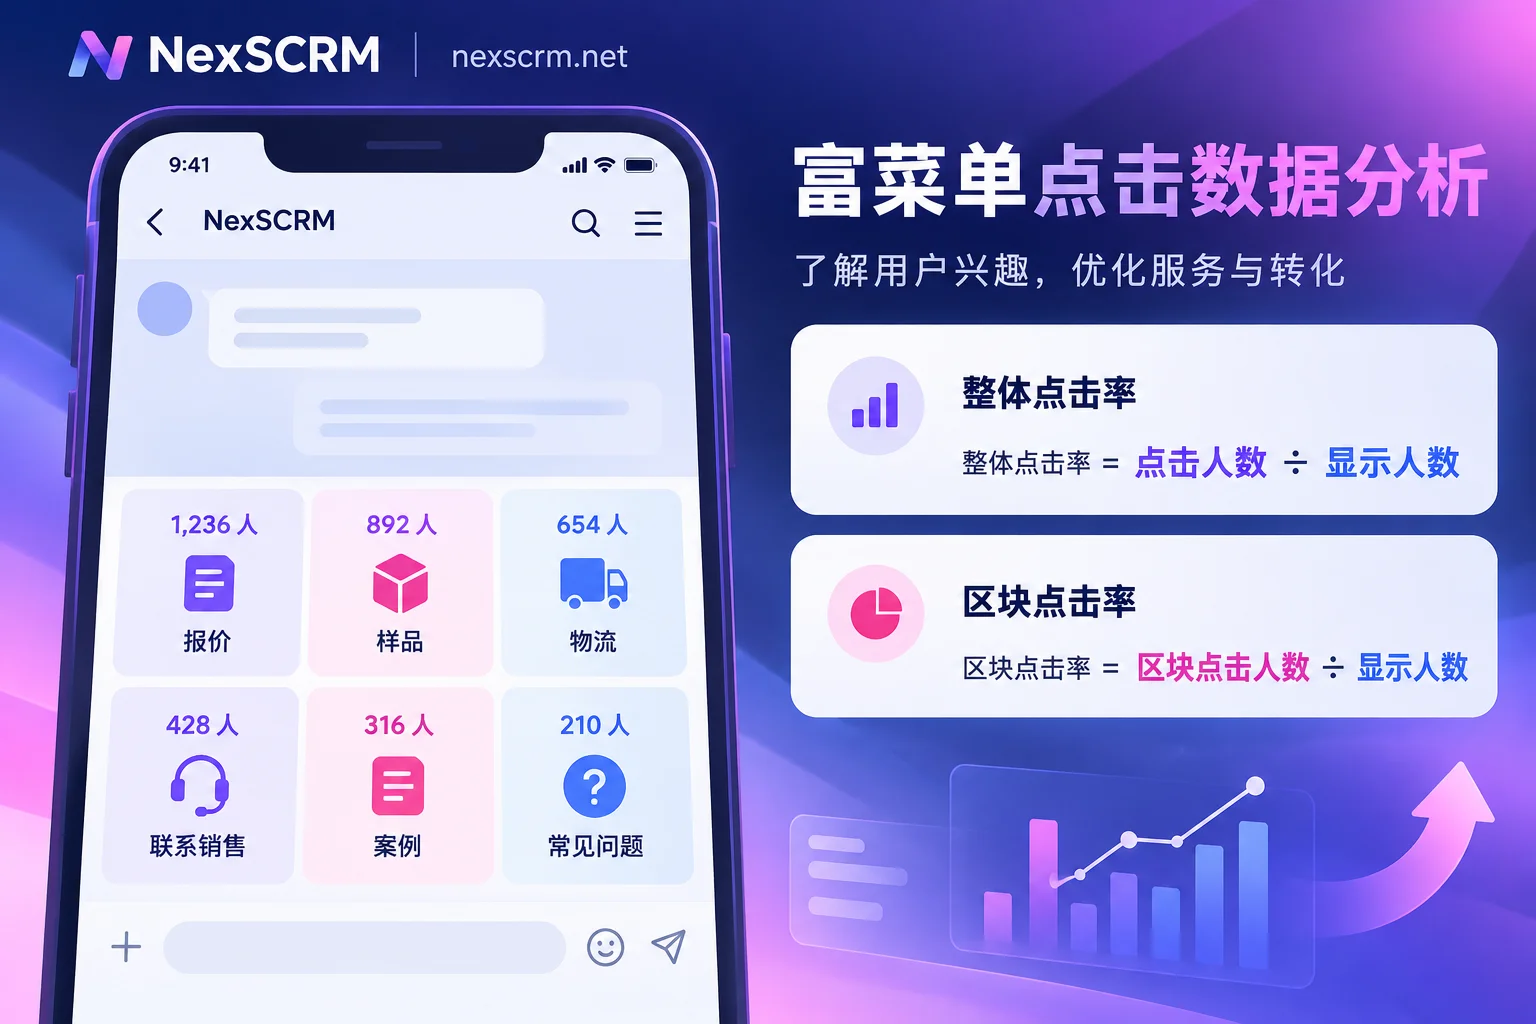
Two common calculation methods:
- By users: Overall CTR = unique click users ÷ unique impression users. This reflects how many people who saw the menu clicked on it, useful for judging overall appeal.
- By events: Click count ÷ impression count. The same person opening the chat and clicking repeatedly will be counted multiple times, useful for observing usage frequency.
Results will differ between the two methods. Use one consistently in weekly or monthly reports so comparisons are meaningful.
For individual areas, you can compare the appeal of each entry point using "unique click users for a specific area ÷ overall unique impression users," or look at each area's share of total clicks to find the most-used features. Note that a person may click multiple areas, so the sum of unique click users across areas will usually exceed the overall unique click users. This is normal, not a statistical error.
Cases Where Data Is Missing or Numbers Don't Match
1. Few click users, only ranges shown or nothing displayed
For privacy protection, LINE does not display exact values when the number of unique click users for an item in the selected period is fewer than 20. It shows an estimated range or nothing at all, to prevent businesses from inferring who clicked. This often happens with accounts that have few friends or unpopular areas. You can extend the date range or combine several weeks of data. Do not use a range value to calculate a precise CTR.
2. Desktop users are not counted
Rich Menus only appear at the bottom of the LINE chat on iOS and Android; the desktop version of LINE does not display them. If your customers mainly reply on computers (as some B2B buyers do), they will not generate impressions or clicks. In that case, a low unique impression count doesn't mean no one sees the menu—it means those users simply cannot see it. Don't put important entry points only in the Rich Menu; keep a copy in welcome messages and auto-replies as well.
3. Menus created via Messaging API are not in backend reports
Only Rich Menus created and scheduled in the Official Account Manager backend appear under "Analysis → Rich menus." Rich Menus deployed by developers via Messaging API are not shown with statistics in this interface by default. If your menus are made by a technical team using the API (e.g., switching menus based on user tags), click data needs to be recorded by the developer in their own system. First clarify how the menu was deployed, then decide where to get the data.
4. You can see clicks but not who clicked
For areas with action type "Send text/keyword," the backend only counts triggers and does not provide a list of users who clicked. However, after clicking these areas, users send a corresponding text in the chat, so staff can see who sent it in the conversation and tag or record follow-ups on the spot.
Using This Data to Adjust Your Menu
Once you have the data, review in the following order:
- Overall CTR is very low: First check whether the menu image is understandable and whether button text clearly states what happens on click. Then check whether the default display setting is expanded or collapsed.
- An area gets almost no clicks: Consider changing its position, rewording, or replacing it with content that is asked about more often. Compare with the most common customer questions in your support records, such as pricing, shipping, or samples.
- Comparing two menu versions: Change only one thing at a time, run both versions for the same length of time, then compare CTR using the same method. If you change the image, text, and order all at once, you won't know which change made the difference.
If the CTR is normal but friend blocks are also increasing, the problem may not be the menu. See How to troubleshoot a high LINE block rate.
Where Users Go After Clicking Needs Separate Tracking
The official backend only counts the step of "clicking a Rich Menu area." After users click and jump to a website or other link, the backend cannot see what they browsed or whether they left an inquiry. There are two common supplementary approaches:
- Areas linking to a website: Add UTM parameters to the link, e.g.,
utm_source=line&utm_medium=richmenu&utm_content=区块名, then filter by these parameters in your website analytics tool. - Areas linking to customer service or sales personal accounts: For example, a "Contact Sales" button that assigns customers to several sales reps—you need to know who was actually added and whether they started a conversation. This can be done with a routing link. In NexSCRM, replace the area's link with a routing link. After customers click, they are assigned to different reception accounts based on rules. Then use Counter and routing link statistics to view each account's new contacts and conversations. This lets you match "how many Rich Menu clicks" with "how many people actually entered a conversation."
Combining these two data sets can show how many new contacts and conversations the Rich Menu entry brought in, but it cannot be directly equated with sales. For how to divide and track click, website, and new-contact data, see How to set up lead generation data tracking tools.


Comments(0)